
Last Tuesday, President Trump tweeted a “warning” on his personal Twitter that if Democrats are elected in this year’s general election,Tax rates will soar,andThe stock market will plummet,yourRetirement accounts will "fragment" and "disappear".
According toAmerican Life Insurance Guide©️Data column reportPointed out that75% of index policyholders have chosen an account linked to the Standard & Poor's 500 Index (S&P 500).Therefore, for most index accounts and any type of retirement account holders, the performance of the stock market is closely related to our pocketbook and retirement funds.

During the 2020 election year, it is no surprise to the public that Trump, the Republican, made such remarks in order to seek re-election.
However, Trump’s remarks gave me new questions. For all those who care about wealth growth, holding 401(k), IRAs, U.S. stock securities accounts and their derivative assets, and especially holdings in U.S. financial insurance policy accounts People-even more and more Chinese insured groups with voting rights,Democrats and Republicans, who will be elected in the 2020 general election, is more beneficial to our wealth accumulation and inheritance?
There is no standard answer to this question.However, just like reviewing the historical performance income data of policy accounts, we have also found review data of the U.S. stock market performance during the presidency of the United States.We hope that through the display of the following graphic data, as a reference on the road to explore each other's answers, we can help you get the "correct" answer that suits you.
U.S. stock market performance during the presidency of the United States
We have drawn the following icons based on the tenures of the US presidents and the trend of the S&P 500 during the corresponding tenures.The market trend is calculated from the day of the inauguration of each president and ends at the end of the presidential term.We will use "month" as the unit (horizontal axis) to show the percentage of growth and decline in the US stock market (vertical axis).The deadline for the S&P500 on the last day of the chart is July 2020. 3,224.73.
List of U.S. Presidents
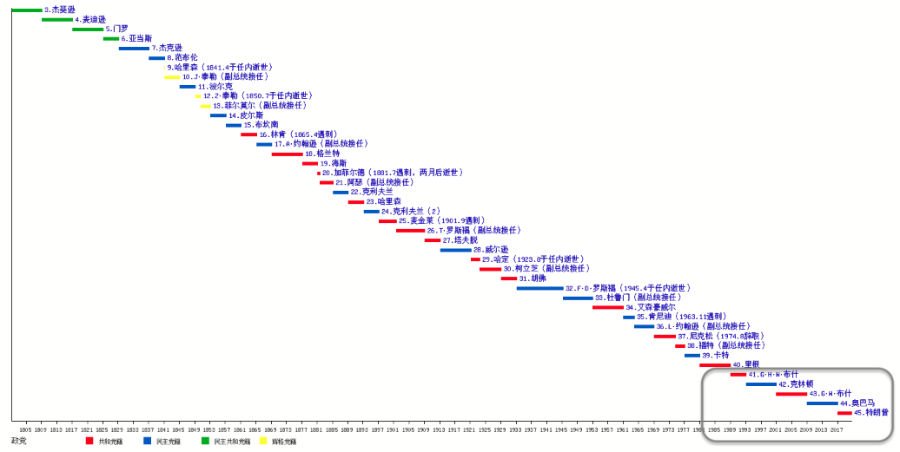
The picture above is a list of all past presidents in American history.Red means Republicans, blue means Democrats.due to401K is a product after 1978.Stock index insurance account is a product after 1997, We have selected the past five (including current) presidents for statistical analysis. They are:
- George GW Bush
- Bill Clinton
- George W. Bush
- Obama
- Trump
S&P500 performance during GW Bush’s tenure
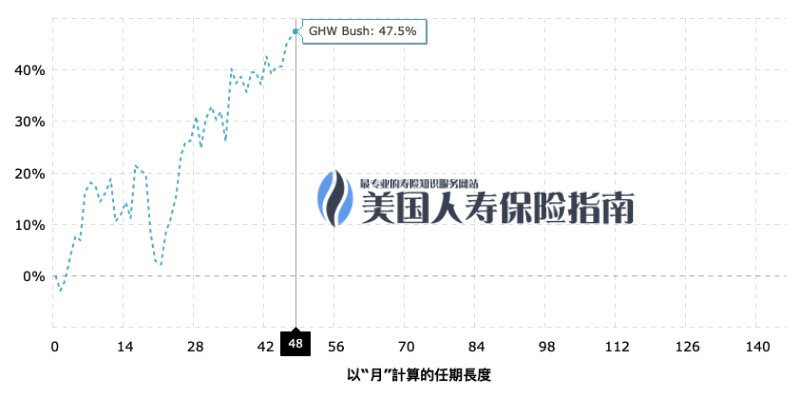
Old bush,Republican Party, Served as President of the United States from 1989 to 1993 for a term of 48 months.The US stock market rose 47.5%.
In the chart below, we use Bush's data line as a reference line for comparison to show the market performance of different presidents.

S&P500 performance during Clinton's tenure
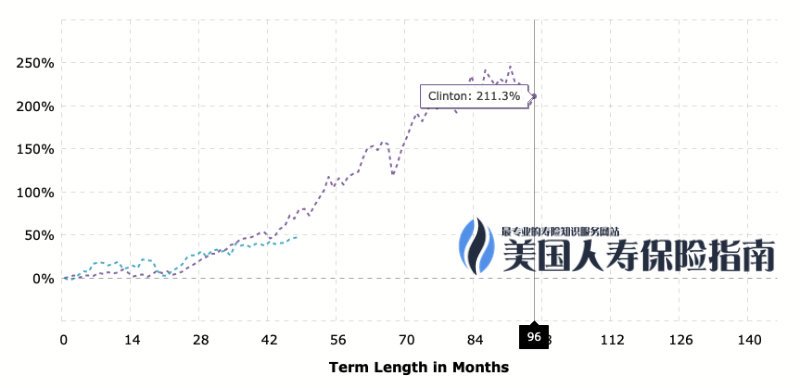 Clinton,Democratic Party, Served as President of the United States from 1993 to 2001 for a term of 96 months.The US stock market rose 211.3%.
S&P500 performance during W. Bush’s tenure
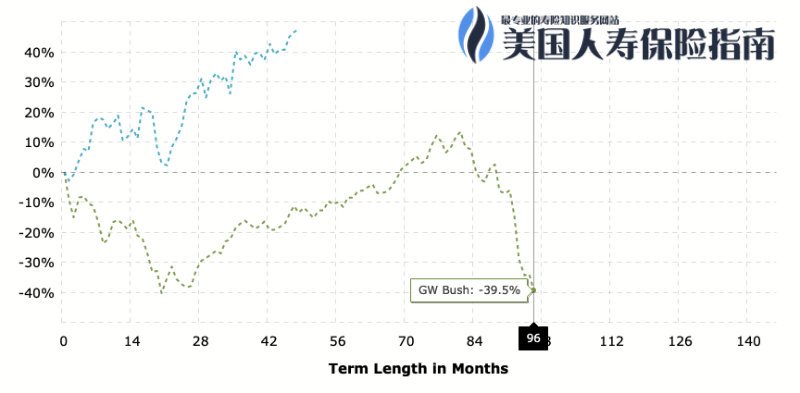 George W. Bush,Republican Party, Served as President of the United States from 2001 to 2009 for 96 months, duringThe US stock market fell -39.5%.
S&P500 performance during Obama's tenure
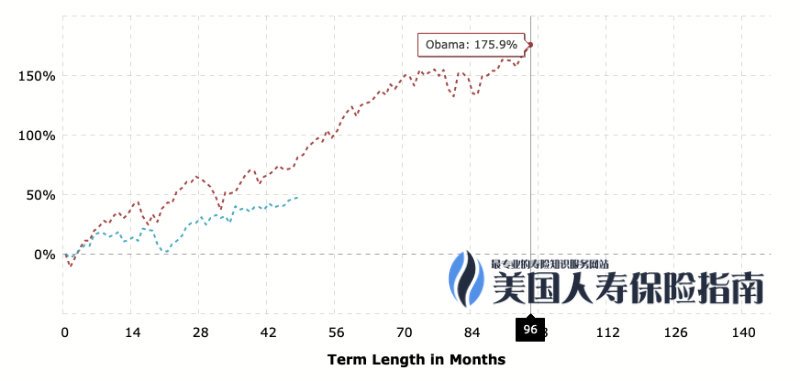 Obama,Democratic Party, Served as President of the United States from 2009 to 2017 for a term of 96 months.The US stock market rose 175.9%.
S&P500 performance during Trump's tenure
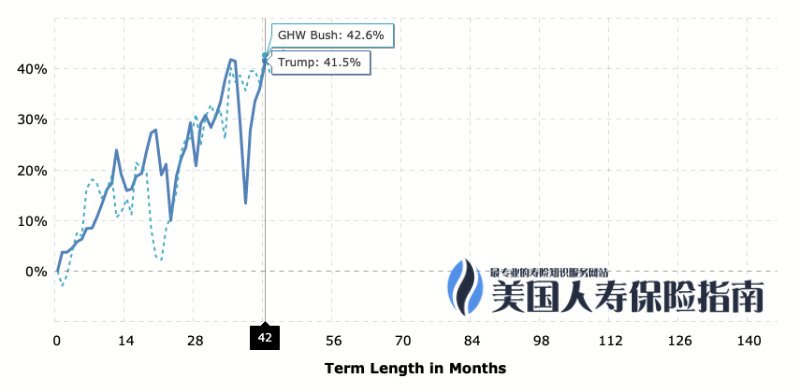 Trump,Republican Party, 2017-now served as President of the United States, has been in office for 42 months, duringThe US stock market rose 41.5%.
We put the tenure data of the five presidents on a chart to observe, and we got the following summary:
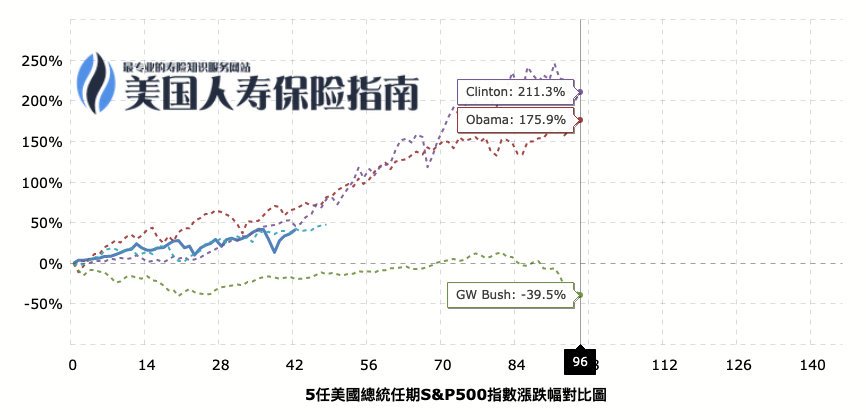
From the above five U.S. presidents, the comparison data of the rise and fall of the S&P5 index during the tenure of the United States pointed out thatDuring the time Democrats Clinton and Obama were in power,The average growth of the U.S. S&P500 market index exceeds 150%.Among them, during Clinton’s tenure,U.S. stock market has doubled.The Republican player’s tenure, the U.S. S&P500 market indexThe highest increase did not exceed 50%, And Bush Jr. successfully pulled his back leg. During his tenure,The S&P500 market index fell 39.5%.
Throughout the past 30 years, forReady to retireFor the group, during the term of the Democratic contestantsOdds of a safe retirement, Higher than the Republican players in power.
At the end of the article, I quoted a graphic comment published by MarketWatch on President Trump’s remarks to summarize it, as shown in the figure below.
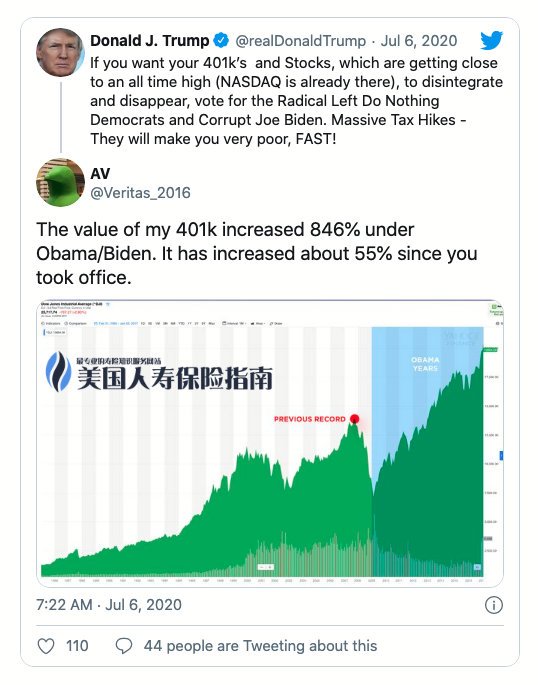 (Credit ©️ MarketWatch)
(>>>Recommended reading: gadgets|The American Personal Pension Smart Calculator, how much do I need to save every month?)